Use the Hot-Accounts Cash Books report to get YTD (Year-To-Date), ROI (Return on Investments) and IRR (Internal Rate of Return) information about your portfolio.
Investment example
In this example, a number of investments are entered in Hot-Accounts according a certain scenario (*). Then, a Cash Books report is requested, with the option to show ROI information + extra calculated fields.
Note: By default, a cash books report shows detailed transactions in chronological order with at the left side account columns and at the right side budget type columns. In this case however, ‘Investments’ and ‘Return on Investments’ columns are shown at the right side. Also extra calculated information can be requested, such as: a running total, a %Year-to-date column, a running total of investments and finally a % return on investment. Also the Internal Rate of Return of the portfolio is calculated at the date of the report.
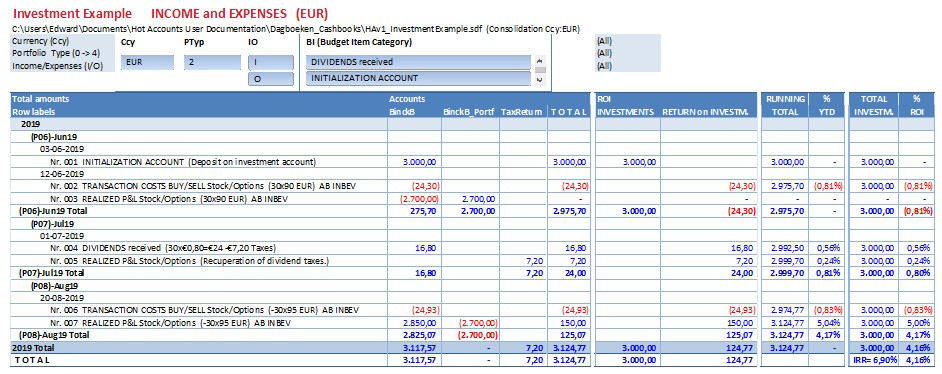
(*) The example has following scenario:
- a deposit of €3000 on investment account BinckB
- The cash amount in BinckB increases with €3000
- This is also regarded as an investment amount at the right side
- purchase of 30 AB INBEV stock shares
- purchase amount = 30 * €90 = €2700
- The cash amount on BinckB decreases with €2700
- The portfolio amount on BinckB increases with €2700
- taxes and broker fees: €24,30
- The cash amount on BinckB decreases with €24,30
- This is regarded as a loss (negative return) at the right side
- purchase amount = 30 * €90 = €2700
- Dividends received (€24, but the broker deducts €7,20 taxes)
- This increases the cash amount of BinckB with €16,80
- This is also regarded as a profit (positive return) at the right side
- The deducted taxes on the dividend are however recoverable. This is booked on a TaxReturn account: €7,20.
- At the right side, this is regarded as a profit of €7,20
- Finally 30 AB INBEV shares are sold:
- sales amount = 30 * €95 = €2850
- The cash amount of BinckB has increased with €2850
- The portfolio amount of BinckB decreases to zero (-€2700)
- At the right side, this is regarded as a profit of €150
- There are however €24,93 taxes and broker costs for this sale
- The cash amount of BinckB decreases with €24,93
- At the right side, this is a loss of €24,93
- sales amount = 30 * €95 = €2850
Information shown in extra calculated columns:
- A colum showing the evolution of the total value of the portfolio at each day, month and year.
- A column with the % change of the total value of the portfolio at each day, month and year.
- In this particular case, the %YTD can’t be calculated for 2019 because the portfolio amount was zero in 2018.
- The %MoM (month over month) and %DoD (day over day) changes are however shown.
- A column showing the the evolution of the total investment amount at each day, month and year.
- A column with the %ROI (return on investment) at each day, month, year and also at total level.
- There is a total return of €124,77 on an investment of €3000 corresponding to 4,16%
- Finally, also the IRR (internal rate of return) of the portfolio is calculated at the date of the report.
- In this example an IRR of 6,90% is calculated at 12 January 2020.
Note: The IRR is the annual interest rate of a fixed rate account which, when subjected to the same deposits and withdrawals as the actual investment, has the same ending balance as the actual investment